Philipp Wambach38 | Software Engineer | Current role: Tech Lead Cloud Data Team @ Ubilabs
Hi! I'm Philipp. I am passionate about all things 3D, Web and Data. This is the place where I write about side & work projects every now and then. Have fun and happy scrolling!
3D Gaussian Splatting – WebGPU Renderer
2023/11
Lately a new rendering technique became very popular in the area of novel view synthesis. With NeRFs (neural radiance fields) being the star for the last two years the paper "3D Gaussian Splatting for Real-Time Radiance Field Rendering" from INRIA produced a lot of attention. In contrast to NeRFs, where a neural network is trained and inferred to create a volumetric representation of the scene, 3D Gaussian Splatting trains (or better optimizes) a point cloud instead. Each point consists of several attributes which together describe a 3D gaussian i.e. an ellipsoid with a gaussian density distribution, opacity, rotation, scale and spherical harmonics coefficients for anisotropic color values.
These properties have two main advantages. Point clouds like this are easy to integrate in traditional rendering pipelines and can therefore be rendered very fast on normal consumer GPUs.
The second advantage, and the reason this technique works at all, is that all of these point attributes are differentiable, so that for any inferred pixel an error value can be calculated and optimized using stochastic gradient descent.
Basically this means that you can input a bunch of images and a list of camera parameters for each image and the algorithm generates a point cloud which, when rendered from a new unknown position, looks like you took a new photo from that position - hence the term "novel view synthesis".
I find this technique very interesting and wanted to understand the inner workings better so I started to build my own renderer for 3D Gaussian Splatting data. Also this was finally a good way to dive deeper into the WebGPU API.
After reading a few papers and watching some Youtube videos to better understand spherical harmonics, the first results seemed promising.
But realising that some of the reference point clouds from the original paper consists of more than 6 million splats I had to rewrite the whole GPU part with compute shaders. This way I could get rid of a lot of redundant operations which before had to be calculted for every vertex.
Another optimisation I made is the rendering of the splat quads. Most of the other renderers use a screen axis aligned bounding quad to render the splat (see green box in video). As you can see, for some splat orientations this results in a ton of unnecessary fragment shader calls. It was a bit of a challenge and included help from twitter and more Youtube videos to calculate stuff like the eigenvalues of the splat's covariance to get an improved quad (filled area in video). But the performance improvement was definitely worth it in the end.
The current version of the renderer is now working and I am happy with the performance so far (rendering most scenes with 60fps on a Macbook M1) but there are still some interesting tasks to do. For example implementing a GPU based sorting algorithm like Nvidia's Onesweep although this for sure is not an easy task.
ESA – Climate from space
2023/03
A really cool project at Ubilabs was to help develop the Climate from Space app for the European Space Agency ESA. Within the app you can explore various climate variables calculated from satellite data which was colected as part of the Copernicus program.
To display these climate variables on a 3D globe we had to process large amounts of remote sensing data with the goal to create equirectagular map tiles to render data with minimal projection distortion on a sphere.
To handle these huge amounts of data we orchestrated a distributed compute pipeline with the help of Apache Airflow. The actual projection and image generation is handled inside the workers with GDAL and python scripts utilizing the xarray package.
Besides the data processing, another great part of the project was to build a tiled 3D globe from scratch. In an earlier version we used Cesium as a 3D globe framework which worked well but had only limited control over how tiles are swapped (and faded) when timestamps change. Therefore we created our own globe framework based on a modular architecture.
The main parts consist of a tile selector which uses virtual texturing and built-in derivate shader functions to generate a list of tiles which need to be rendered for the current camera values (shout out to my colleague Martin here who came up with the idea!). Other parts are the tile loader, mainly responsible for dispatching, caching and aborting network requests and the tile renderer which handles all of the tile to 3D projections inside the vertex shader.
BigData, dbt and Ethereum
2023/02
A perfect source for big data projects is a public blockchain. It offers free, open and in the case of Ethereum, relatively easy accessible data. I have been a fan of the Ethereum project for a while and did already build some data visualisations, but now I wanted to analyze the chain both more performant and at a way larger scale.
But there are two problems: There is a lot of data and it is encoded! For this reason I utilised Google's Data Warehouse solution BigQuery which we also use a lot at work. BigQuery is a serverless and managed Data Warehouse inside the Google Cloud. The best part of using BigQuery for this use case is that Google is already injecting the complete Ethereum blockchain into a public dataset. So the ingestion part was already done, yay!
Analysing blockchain data can get quite complex. BigQuery uses SQL to query data, so an obvious choice was to use dbt as a data modelling tool. dbt is a widely used tool written in python which allows to structure SQL queries into models, use Jinja templates, test your data and a lot more. With the help of dbt it's quite elegant to extract smart contract metrics. But there is still a major problem that remains: decoding the data.
Each Ethereum transaction and log (with a transaction being the user initiated call to a smart contract and log the data a transaction saves into a special log state) includes a binary data blob which encodes call parameters and log values. The encoding depends on the smart contract code, for example the call data for a function: fn(a: uint256, b: uint32[]) can only be decoded correctly if you know what the function signature looks like. Decoding this data within SQL is theoretically possible but would be a real pain. One solution here is to use BigQuery's UDF functions. These user defined functions can be written in Javascript and are executed inside the BigQuery workers with the advantage that you can also import external dependencies. "ethers.js" did the trick here and provided the decoding logic.
To bring everything together I created a small CLI script that takes a smart contract definition (ABI) and a contract address, creates the specific decoding functions and outputs the ready to use dbt models. All of the dbt models are incremental so that running the queries at a fixed interval like every day, will not read the whole table again and thus prevent a huge bill from Google. Trust me it can get expensive very fast if you are not setting the correct query filters! :)
All the code and some example dbt models can be found in this repo on GitHub.
Google I/O Flights
2022/08
At Ubilabs we build a demo for the new capabilities of the Google Maps Javascript SDK. The new features include better deck.gl integration, which enables fast rendering of large amounts of data with the power of WebGL. A great showcase with a lot of moving data points is global air traffic.
We obtained data from several flight APIs and transformed it into one seemless loop of 24 hours of flights around the world. The final dataset includes more than 640 airports and over 20.000 flights. There are more flights each day but for the sake of beauty we concentrated on longer distance flights. The final demo which was showcased at Google's I/O 2022 conference can be viewed here: https://geo-devrel-io-2022.web.app.
OSM Nodes
2021/02

Here is a quick hackday project. While OSM has a lot of public mapping data, it oftentimes is not easy to access this data. BigQuery, Google's Data Warehouse luckily has a public dataset which includes all gobal OSM nodes.
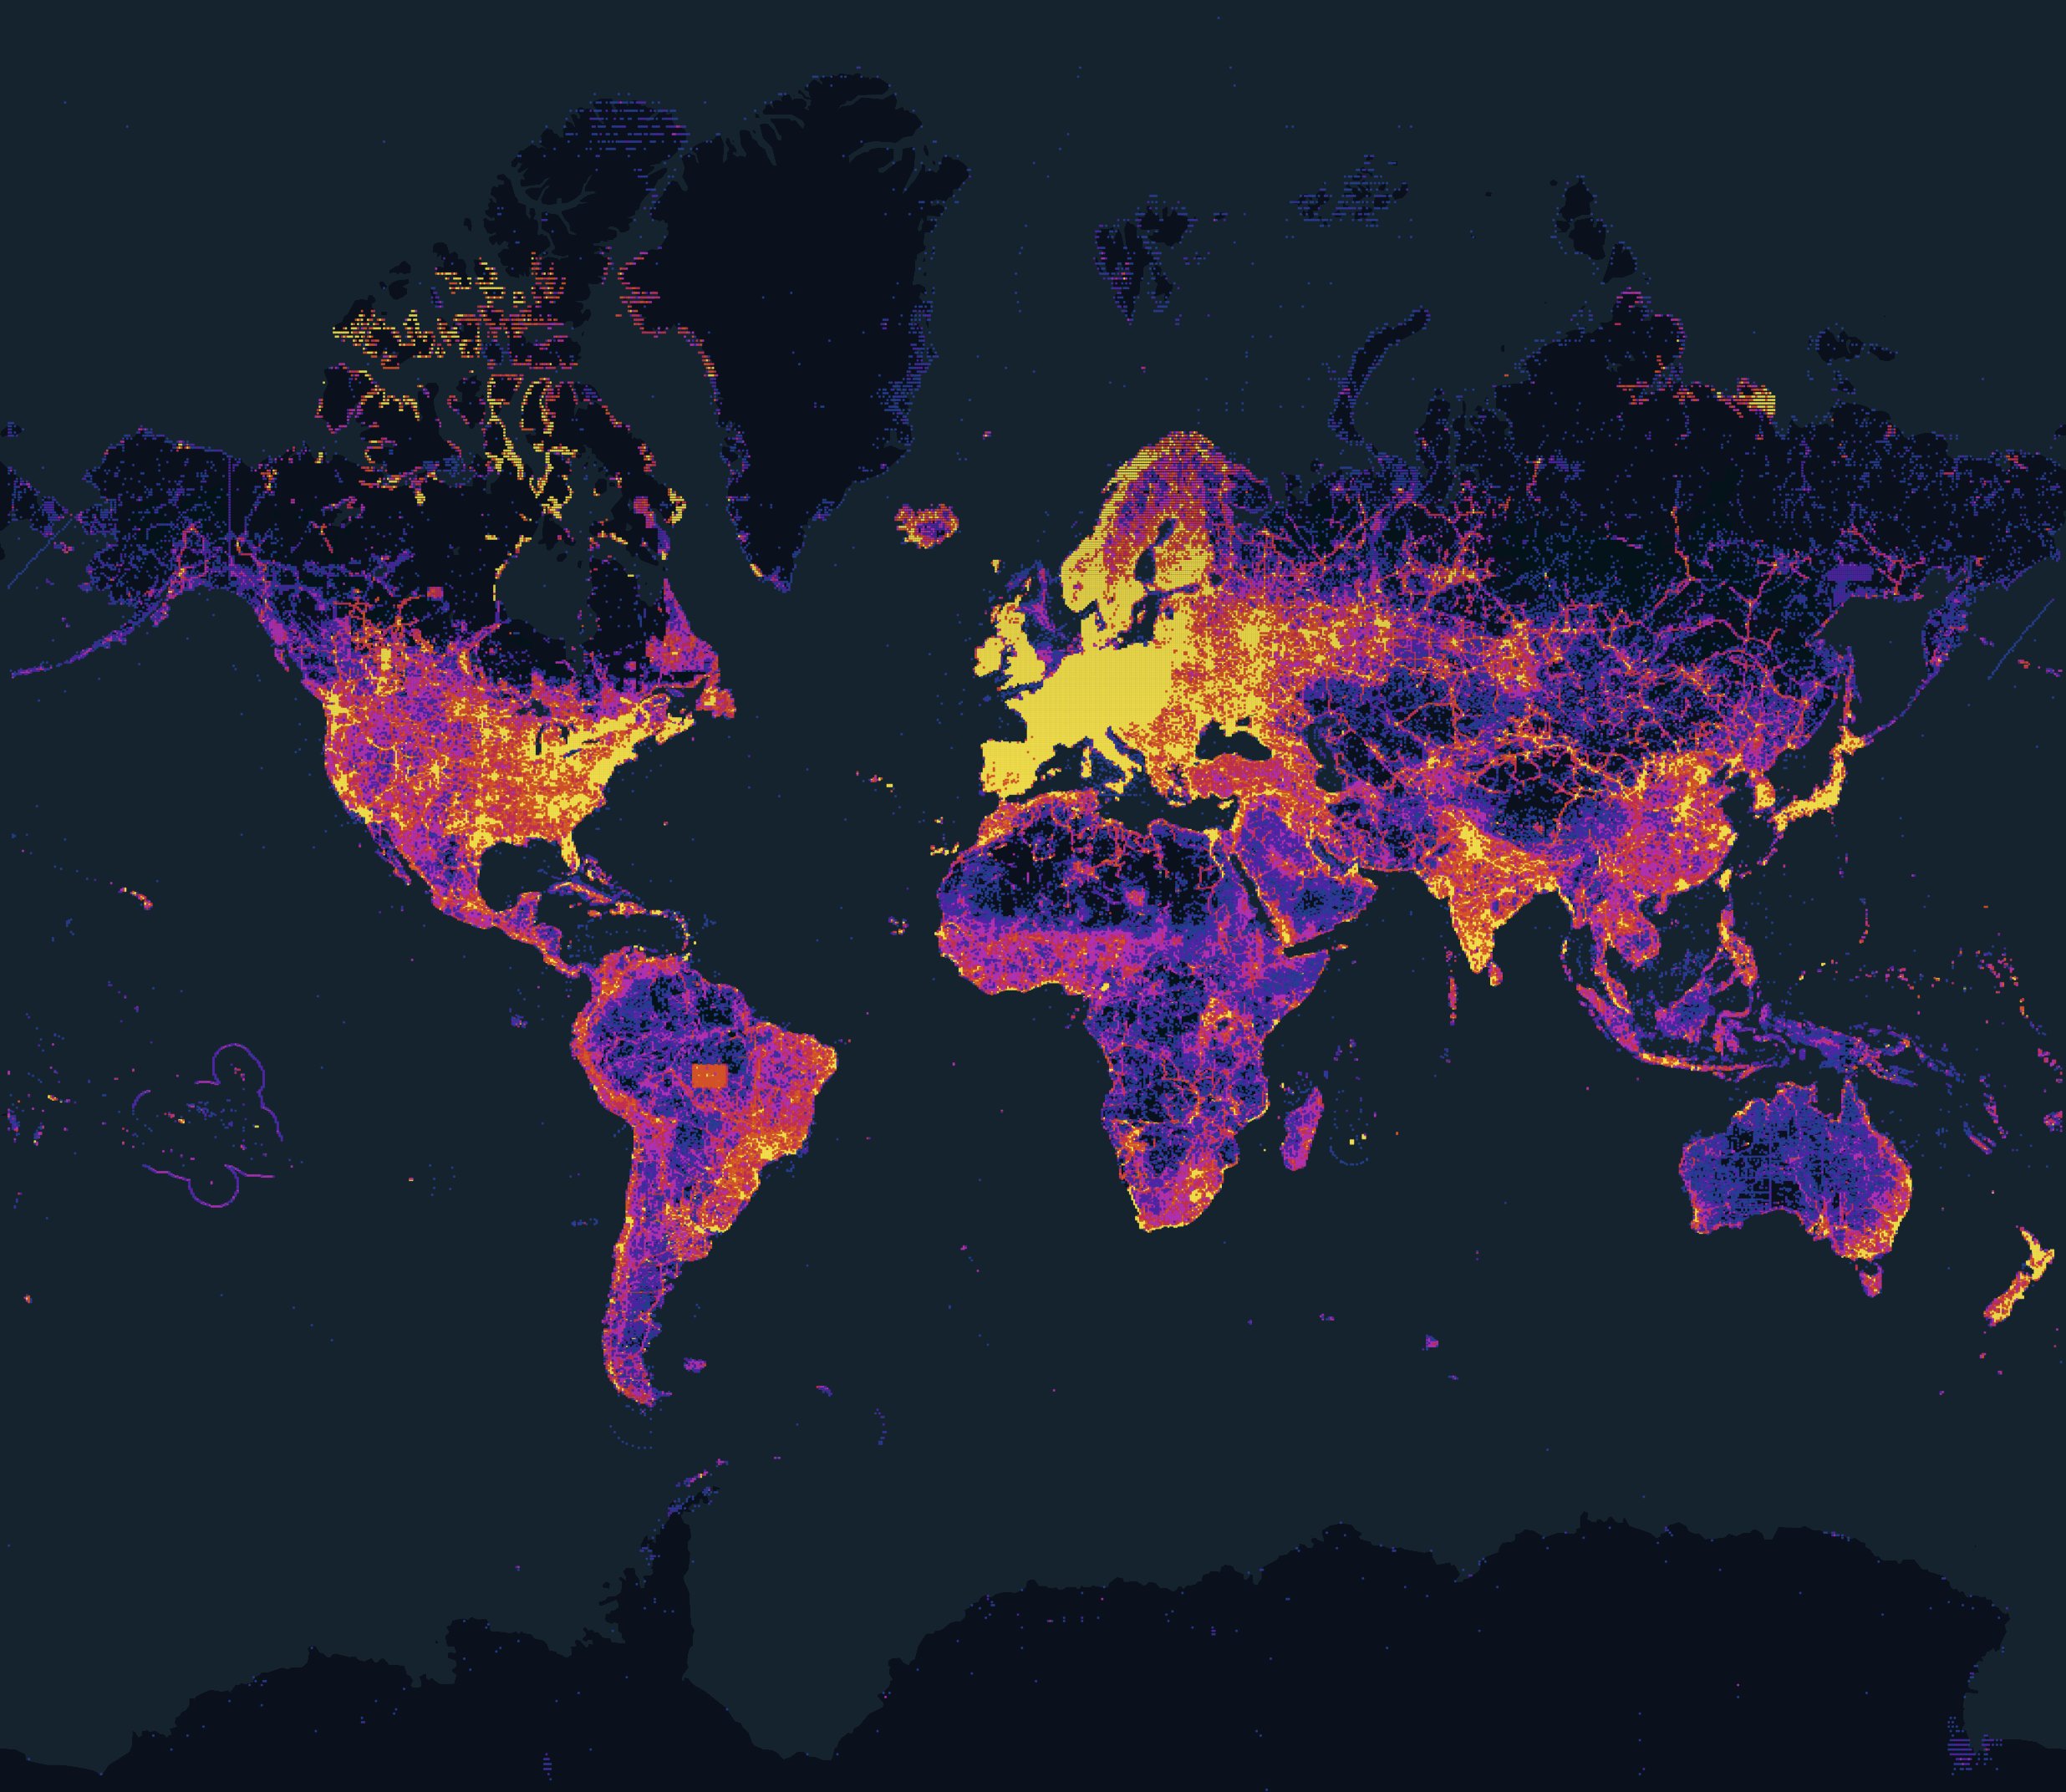
The idea was to visualize the density of all OSM nodes of the entire world to see where participation is good and which areas could still benefit from more contributions. The final query takes all of the 6.6 billion(!) points and aggregates them by their geohash. The resulting image was rendered with deck.gl utilizing the performance of WebGL to render the aggregated 2k * 2k points with a nice color scale. Altough over 6 billion points were processed, the execution time of the query was relatively short with round about 20 seconds.
Unity VR Game for Oculus Quest
2020/04

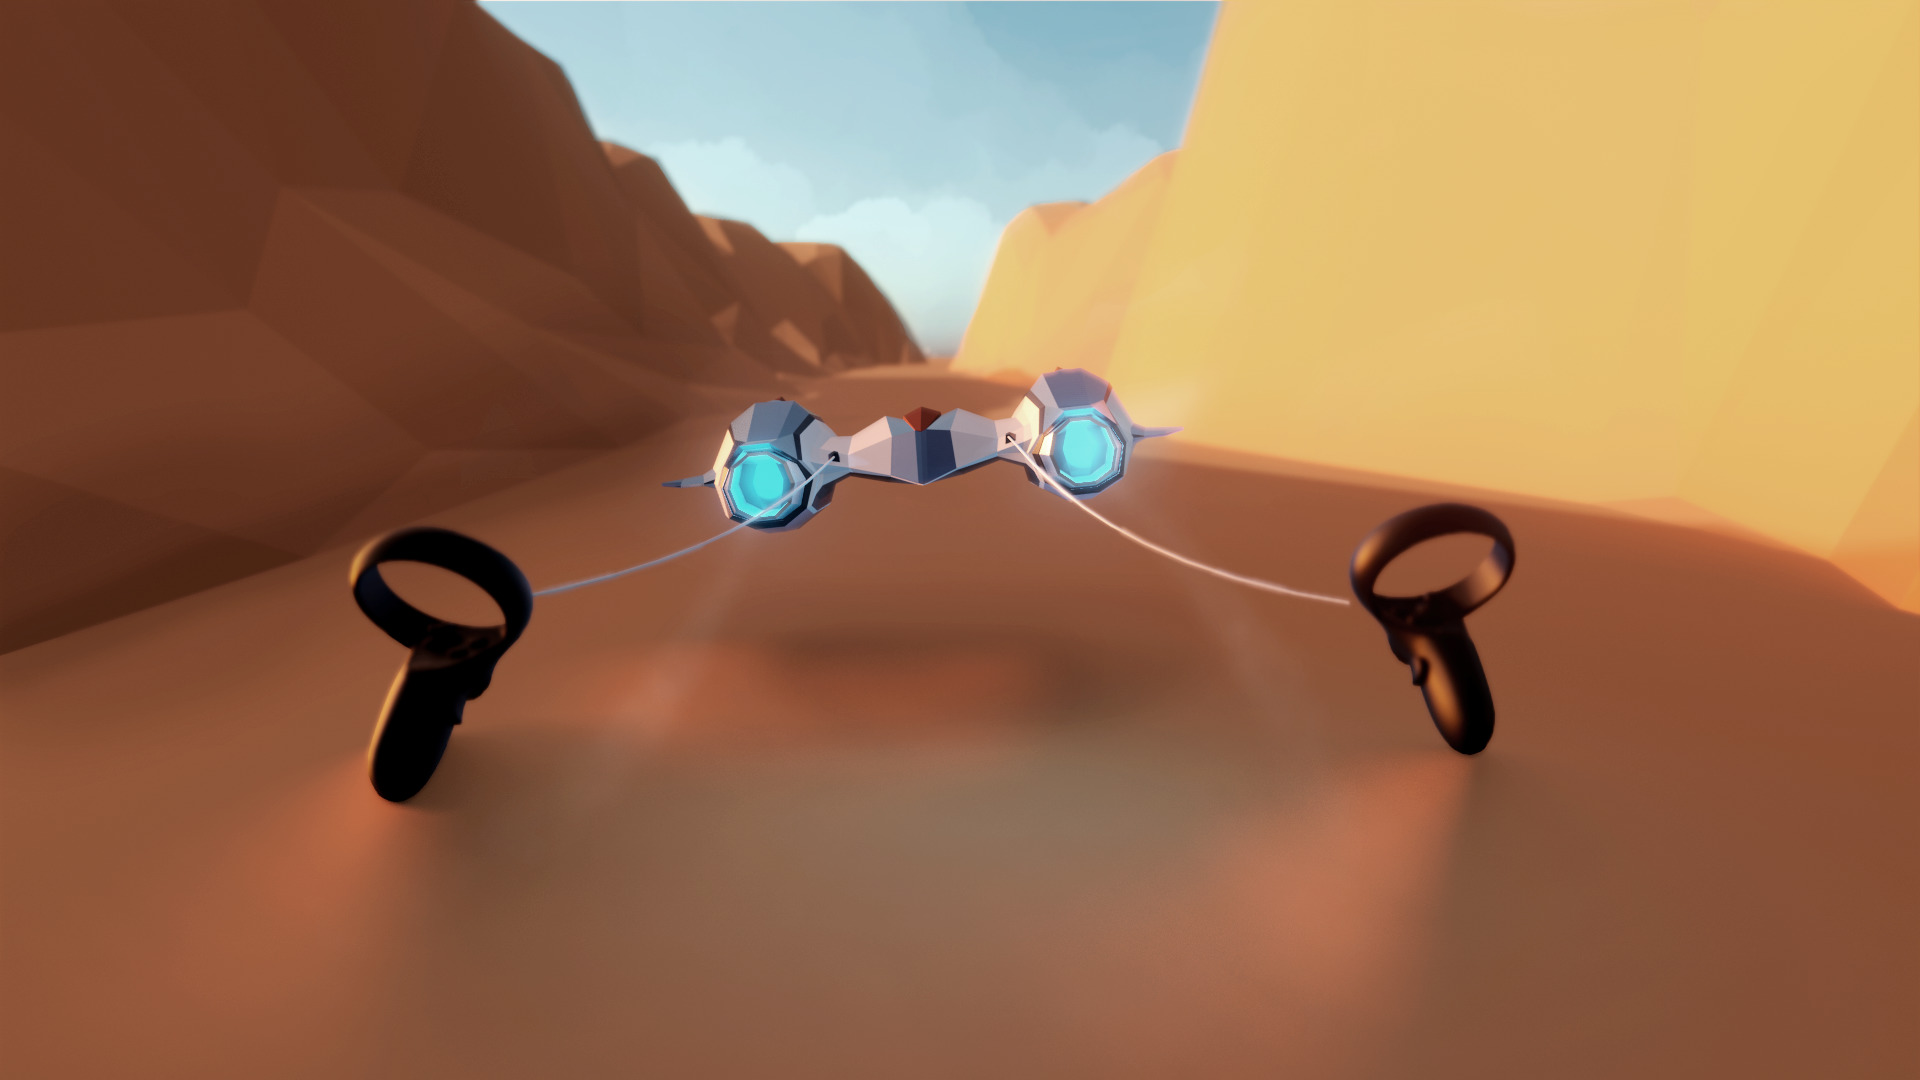
I finally have a Oculus Quest. After trying out a lot of games, some disappointing, some mediocre and some really showing the potential of VR, I wanted to know what it's like to build a VR game by myself. With the help of Unity's Oculus integration I quickly managed to get something on my headset and decided to try a racing game inspired by the good old Star Wars pod racing. With a mix of drive and fly and controlling the racer with your hand movement, the name "TurboKites" was born.
It was a lot of fun and I learned a lot about 3D in Unity but the game has a long way to go to become a AAA best seller :). Although the physics and the sense of speed worked out really well in VR! With a Oculus Quest headset you can download the game for free from the Sidequest Store. Let me know what you think!
Raytracer
2019/11

I guess for everyone who is doing stuff in 3D comes the time to write a raytracer. This is my turn. Based on this great series by "Three Eyed Games" I gave it a try. The cool thing about this raytracer is that it uses compute shaders for most of the calculations.

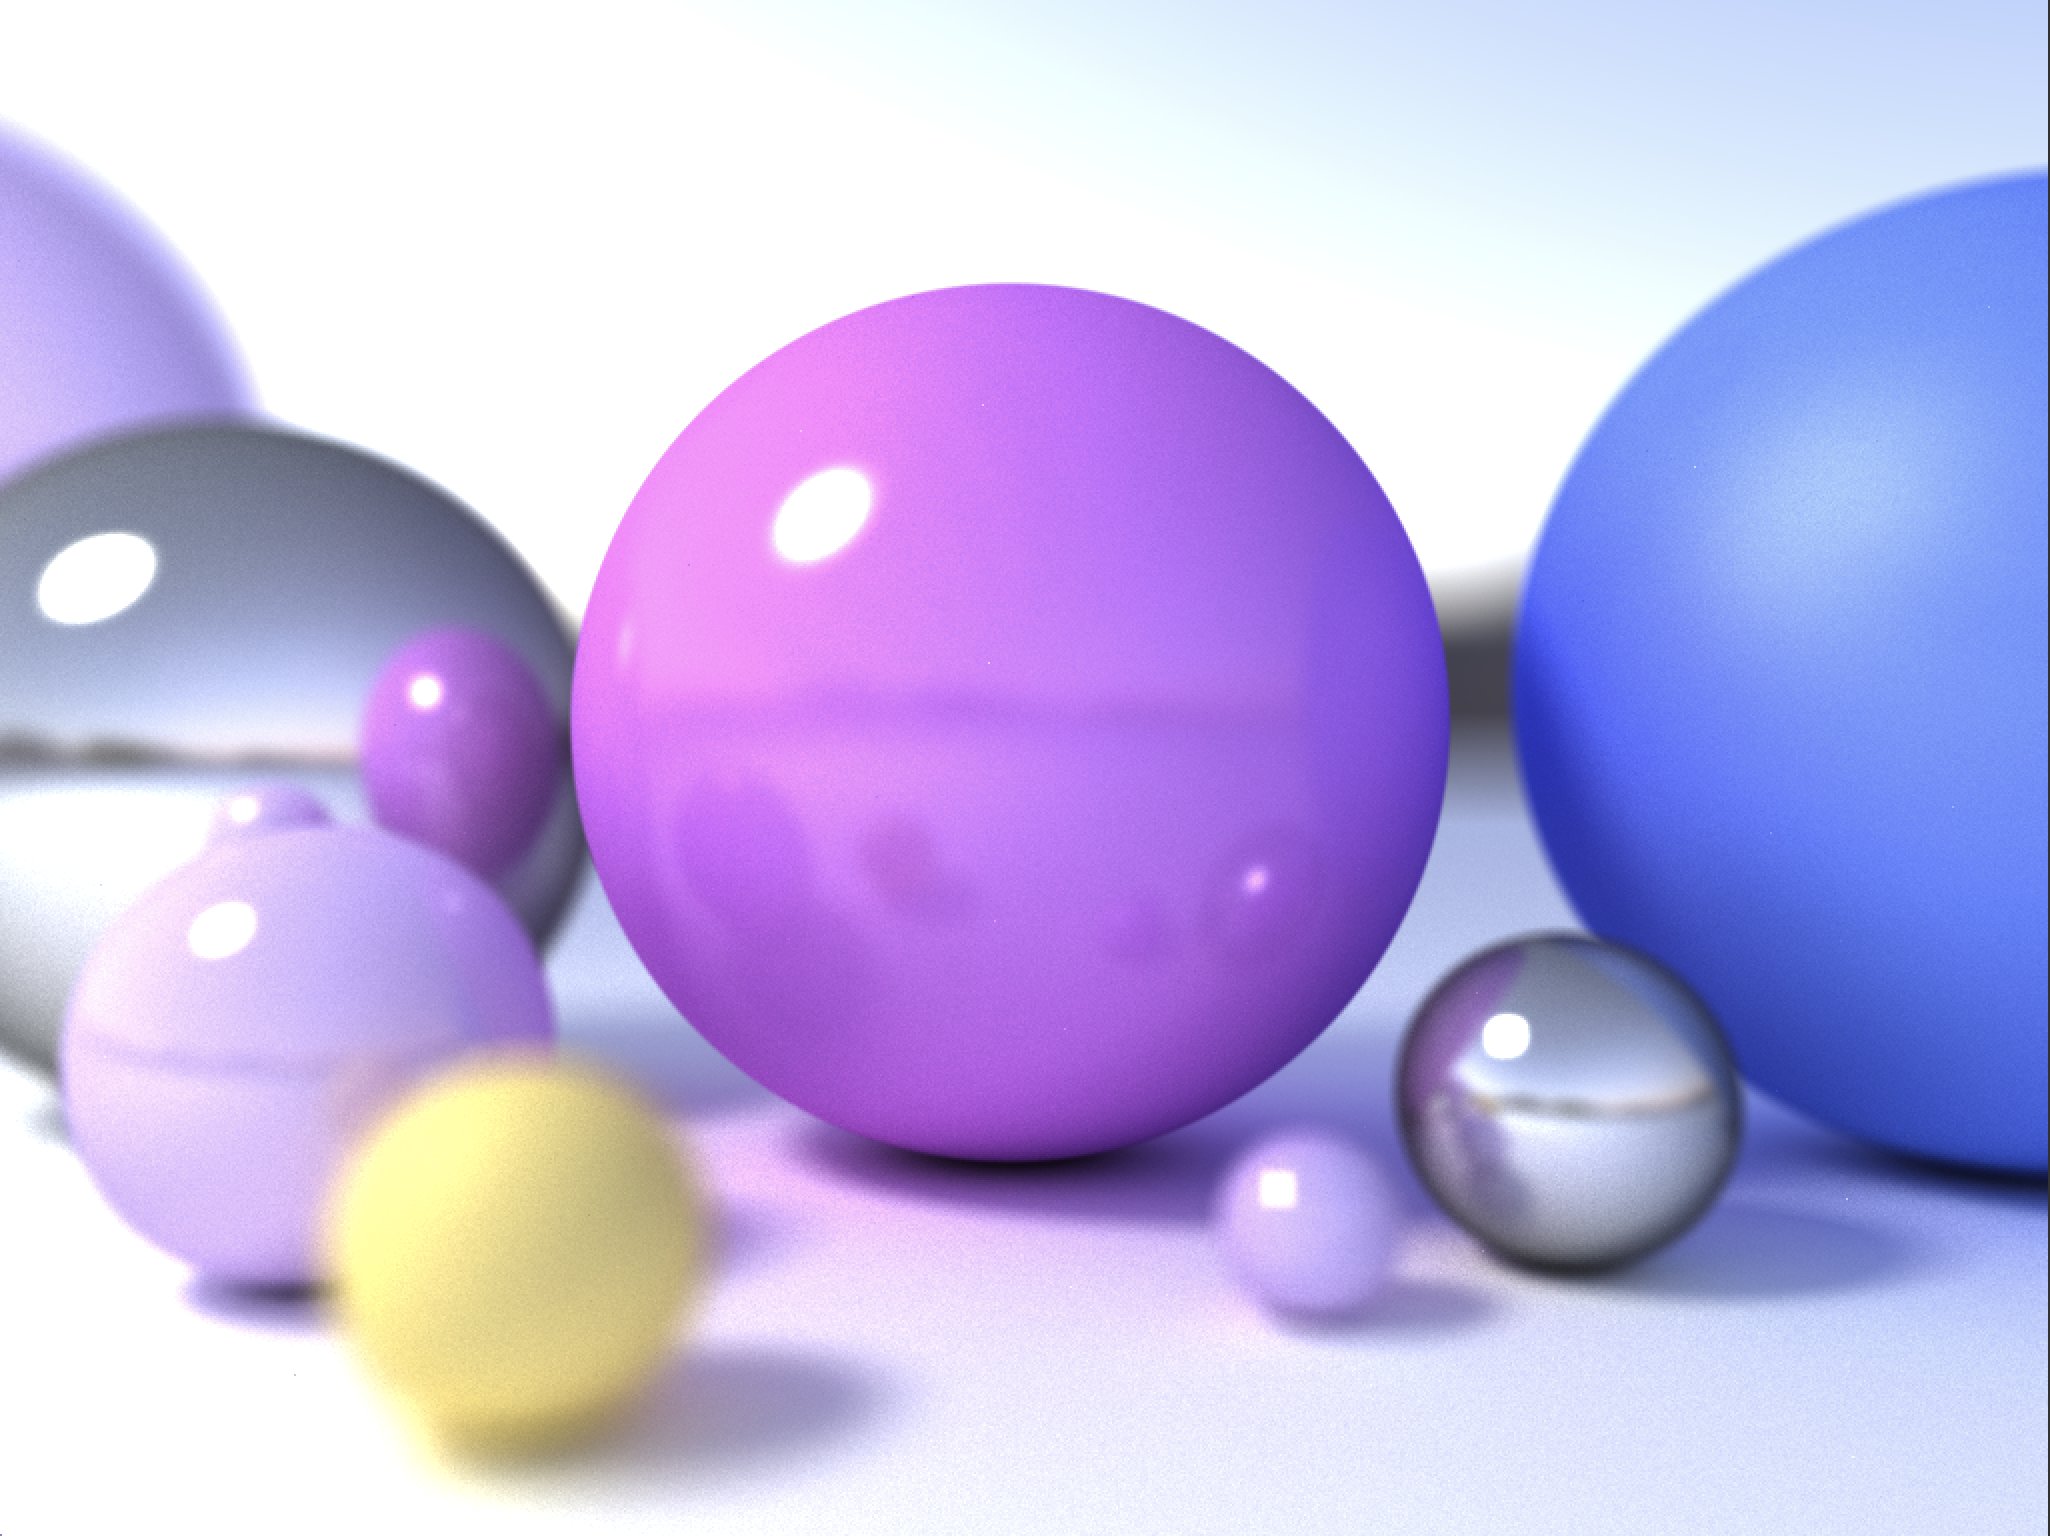
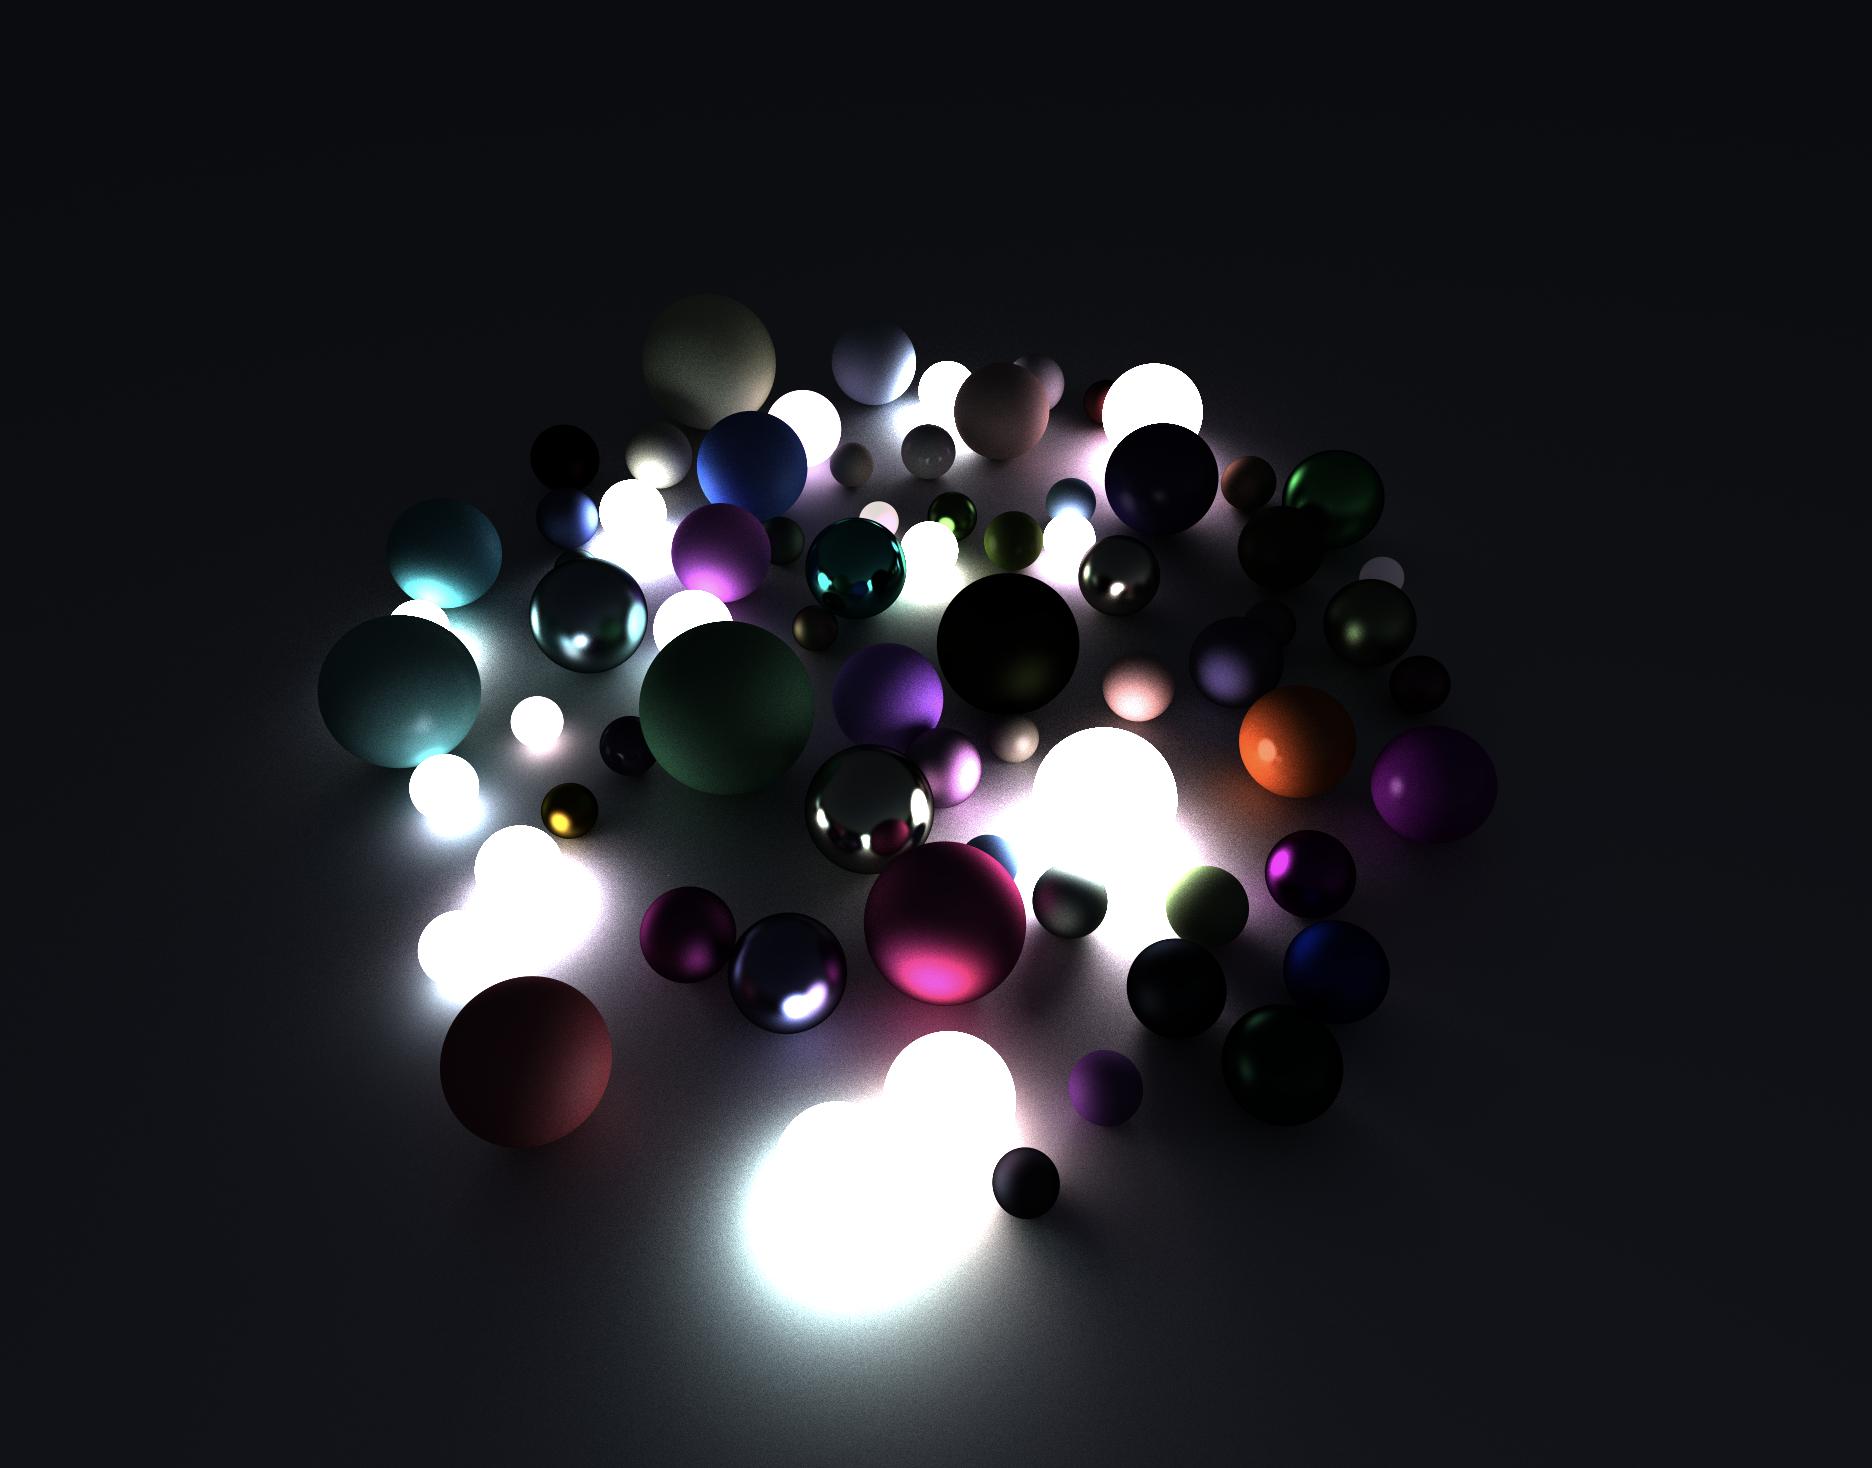
As you can see in the screenshots it is a very simple raytracer and for now only supports spheres. On the other side it supports multiple materials, ambient and directional lights, reflections, emission and multi-frame sampling. Perhaps I will continue to add more features but for now I am happy with the results and glad that I learned a lot from this project.


